Skip to content
Jagoan Cloud Docs
  • Solutions
    • Server Ujian Online
    • Scalable WordPress
  • Products
    • Jagoan Cloud PaaS
      • Pricing
    • Cloud Backup
    • VPS Windows
    • Business Mail
    • SSL Certificate
  • Login App

Rapor Digital Madrasah

  • Cara Instalasi RDM

Panduan Dasar

  • Cara Memasang SSL di Jagoan Cloud
  • Mengubah domain Jagoan Cloud ke Domain Sendiri
  • Cara Menambahkan IP Public

Moodle

  • Cara Login ke Server Moodle di Jagoan Cloud
  • Cara Login ke Aplikasi Moodle di Jagoan Cloud
  • Cara Menggunakan Domain Pribadi untuk Aplikasi Moodle

Quick Start

  • Getting Started
  • Dashboard Guide
  • Welcome Tutorial
  • Software Stack Versions

Platform Overview

  • What is Platform-as-a-Service
  • Concept and Terminology
  • What are System Containers
  • What are Application Containers
  • Isolated Containers
  • What is Auto-Clustering
  • Cloudlet

Containers

  • Container Types
  • Container Image Requirements
  • Connect to Custom Container
  • Custom Container SSH Access
  • Private Registry Inside PaaS
  • Building Custom Containers

Environment Management

  • HTTP Headers
  • Clone Environment

Application Settings

  • Configuration File Manager
  • Managing Timezone Settings

Development Tools

  • FTP/FTPS Support

Account and Pricing

  • Account Registration
  • Account Types
  • Account Statuses
  • Account Password Reset
  • Quotas System
  • Two Factor Authentication
  • Personal Access Token
  • Upgrade and Refill Account
  • Pricing Model Overview

Architecture Overview

  • Cluster Overview
  • Cluster Orchestrator

Container Deployment

  • Certified Containers Deployment
  • Custom Containers Deployment
  • Docker Engine Deployment

Container Redeploy

  • Redeploy Overview
  • Preserve Data

Container Configuration

  • Configuration Tools
  • Container Environment Variables
  • Container Linking
  • Container Volumes
  • Container Ports
  • Container Run Configuration

Environment Variables

  • Java Options and Arguments
  • Default Environment Variables
  • Custom Environment Variables

Environment Groups

  • Overview
  • Group Creation
  • Navigation Between Groups
  • Group Management
  • Environment Isolations

Scaling and Clustering

  • Automatic Vertical Scaling
  • Horizontal Scaling
  • Automatic Horizontal Scaling
  • Data Synchronization
  • File Synchronization in Cluster
  • Auto-Clustering of Instances

Built-In Monitoring

  • Log Files
  • Statistics
  • Load Alerts

SSH

  • Generate SSH Key
  • Add SSH Key
  • SSH Access

Resource Charging

  • Pricing FAQ
  • Charged Resources
  • Monitoring Consumed Resource

Kubernetes

  • GitLab CI/CD Integration
  • Cluster Automated Upgrade
  • Public IP for Access to Kubernetes
  • Traefik v2 Ingress Controller

Kubernetes Cluster

  • Kubernetes Overview
  • System Requirements
  • Cluster Installation
  • Cluster Versions

Managing Kubernetes

  • Cluster Access
  • Access Controll
  • Cluster Troubleshooting
  • Cluster Upgrade
  • Velero Backup

Kubernetes Scalability

  • Vertical Scalling
  • Horizontal Scalling

Application Deployment

  • Helm Integration
  • YAML Deployments
  • Internal Networking
  • Exposing Services
  • Creating Ingresses

Persistent Data

  • Volume Provisioner
  • Persistent Volume Claim
  • Custom Storage

Domain Name Management

  • Swap Domain
  • Multiple Domain for PHP
  • Container DNS Hostnames

External Access to Applications

  • Shared Load Balancer
  • Public IP
  • Container Firewall
  • Endpoints

Traffic Distributor

  • Traffic Distributor Overview
  • Routing Methods
  • Traffic Distributor Installation
  • Traffic Distributor Integration
  • Use Case

SSL

  • Secure Socket Layer
  • Built-In SSL
  • Custom SSL
  • Custom SSL via SLB

Scheduling Configuration

  • Setting Up Cronjob
View Categories
  • Docs
  • Panduan Penggunaan Layanan & Platform Jagoan Cloud
  • Jagoan Cloud PaaS
  • Panduan Dasar
  • Application Settings
  • Built-In Monitoring
  • Log Files

Log Files

2 min read

View Log Files #

File log adalah sumber utama informasi penting tentang apa yang terjadi di environment Kamu. Misalnya, setiap proses pengembangan atau pengujian pasti membutuhkan akses ke informasi penting ini.

Jadi, untuk melihat log dari node-mu, ikuti langkah-langkah berikut:

1. Masuk ke dashboard Jagoan Cloud menggunakan kredensial kamu.

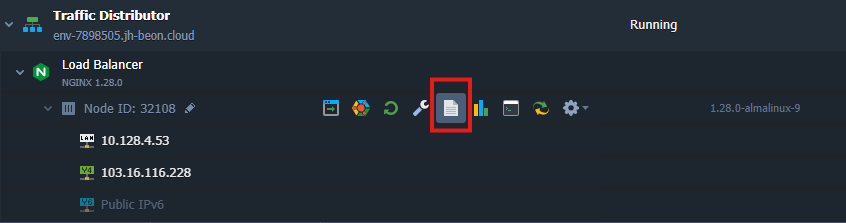
2. Klik ikon Log pada node yang ingin kamu periksa.

3. Tab Logs akan muncul di bagian bawah dashboard. Kalau environment-mu memiliki beberapa node dengan jenis yang sama, Kamu bisa memilih node yang ingin dilihat log-nya melalui daftar drop-down yang tersedia.

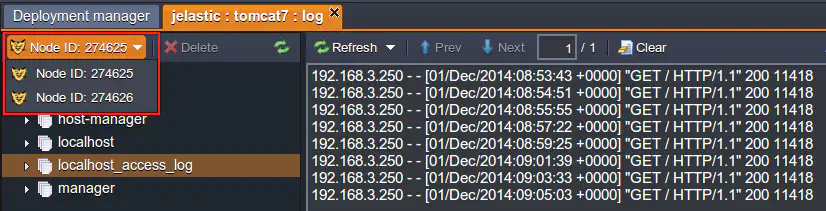
Kamu bisa menggunakan tombol-tombol di atas teks log untuk menghapus isi log (Clear), memuat ulang log (Refresh). Serta menggunakan tombol Prev dan Next untuk menavigasi isi log jika ukurannya besar atau panjang.


💡 TIP
Agar pemantauan log jadi lebih nyaman, fitur Auto refresh digunakan. Dan secara default fitur ini sudah aktif. Fitur ini membuat file log yang sedang dibuka akan diperbarui otomatis setiap 3 detik, sehingga Kamu tidak perlu menyegarkan log secara manual untuk mendapatkan informasi terbaru. Ini sangat membantu untuk memantau proses secara real-time, seperti saat instalasi atau update.Kalau terjadi masalah dan Kamu ingin fokus pada informasi tertentu tanpa terganggu oleh pembaruan baru, Kamu bisa menonaktifkan Auto refresh. Caranya, hilangkan centang pada opsi Auto refresh di menu Refresh di atas jendela log.Dengan cara yang sama, Kamu juga bisa mengaktifkan kembali opsi Auto refresh kapanpun Kamu mau. Cukup centang kembali opsi tersebut di menu Refresh di atas jendela log


4. Setiap file log dalam folder bisa dengan mudah dihapus langsung dari daftar log. Untuk melakukannya, arahkan kursor ke log server yang ingin dihapus lalu klik ikon silang (×) atau ikon sampah yang muncul, atau pilih log-nya dan tekan tombol Delete di panel alat bagian atas.

5. Log juga bisa diunduh melalui FTP.

6. Berikut adalah daftar file log yang tersedia dan bisa kamu lihat, tergantung dari jenis node yang kamu gunakan:

Node Available log files
Tomcat 6, 7
TomEE
manager
localhost_access_log
catalina
host-manager
localhost
Jetty {date}
request
GlassFish {date}
request
MySQL
MariaDB
mysqld
PosgreSQL postgresql-{day of week}
CouchDB couch
MongoDB mongod
Apache access-log
dummy-host
error_log
NGINX PHP error
access php-fpm
NGINX load balancer tcp_access
error
error_log
access
localhost
Memcached memcached
Node.js node


💡 TIP
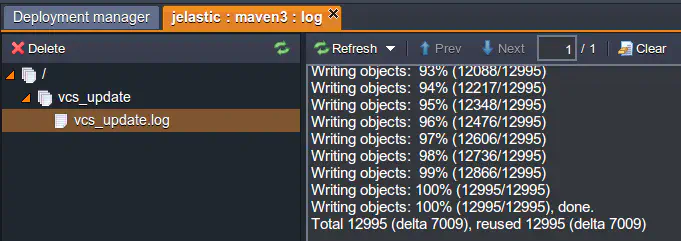
Jika kamu menggunakan repositori GIT/SVN jarak jauh untuk melakukan deployment aplikasi, maka akan muncul file log baru bernama vcs_update pull di node Maven (untuk Java) atau server aplikasi Apache/NGINX (untuk PHP). File log ini berisi informasi tentang proses build dan deployment dari proyek Kamu.
What are your Feelings

Share This Article :

  • Facebook
  • X
  • LinkedIn
  • Pinterest
Still stuck? How can we help?

How can we help?

Updated on August 21, 2025

Powered by BetterDocs

Daftar Isi
  • View Log Files
© 2022 Jagoan Cloud